I think I can explain it to you, but you have to understand this is an explanation from a global warming skeptic, so it's most likely biased. No apologies. Most of this stuff is from one side, or the other. You must choose what you find makes most sense to you.
There is no such thing as an ice-free summer to this point on the satellite record (about 30 years). The Gore brigade predicts the coming of such phenomena soon. If the're as accurate with that prediction as they have been with all their others, don't be packing your swimwear for a summer trip
to Northern Greenland.
Here's a graph of sea ice extent.
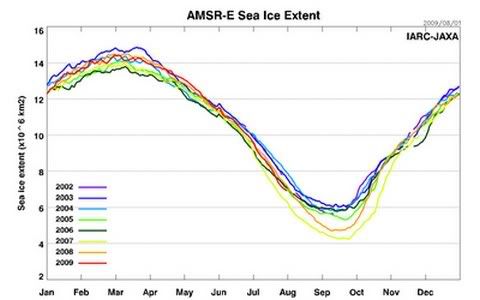
See that red line? That's us, more or less right now in 2009. The gold line is 2008. This year when you see the red line dip below the gold line you'll hear a bunch of hysterical mainstream articles about the melting arctic. That's where the confusion comes in, and why you think there's an ice-free arctic right now.
Really though, all the fuss is about what happens from mid-august to mid-september.
You see the the light green line that dips down towards the bottom in September? That's 2007. That's the bad guy. That was a record low for the satellite record (about 30 years). Last year a little ice came back, but not so much you can make a point.
Curiously enough most of the ice that goes during this latter period of the melt season is a result of winds, currents, and such, not warm temperatures. Last year you'll notice there was lots of ice, until the beginning of August. There was a major storm in the arctic. It broke up the ice, and sent it south to melt.
OK back to the red line. You see how it's dipped below the gold 2008 line for the present. If that line continues down between 2008, and 2007, you'll see a hair-pulling frenzy of melting arctic stories in the media. If it swings over, and finishes between 2008 and 2005, you'll hear crickets.
Now me I'm predicting the latter. Apparently what's happened this year is winds have pushed north, compacting the ice. I think maybe there's more ice up there than what you saw last year, you just don't see it on the graph. It's calculated somewhere, I just can't remember where. I could be wrong.
If you want to follow this graph, it's updated daily.
http://www.ijis.iarc.uaf.edu/seaice/ext ... Extent.png


") Forum Elite
Forum Elite