The reason I used CPI in this case to indicate why the project costs shouldn't be assosiated to housing prices besides the obvious problems of using real estate prices as a price point is because it, along with GDP deflator, function using a percentage change to get the general area of inflation. Given that, even though GDP and CPI are different values, typically they move somewhat together and show the same general range of inflation, and since we were dealing with a large gulf between the values I felt were acceptable and the ones quoted I felt that the error of using this measurement between those two points of time was alrigh.
My main aim was to argue that just because house values doubled, didn't mean that overall all prices doubled, which is why I used the CPI index. Using the CPI index put that change at or around 16-20% using the methods mentioned. Given how different 16-20% is from 100% inflation, I figured it was a safe form of measurement to use in my example between the time mentioned and the current time (early 2000s, mid-2002 specifically, I think, to as close to now as I could get using Bank of Canada measurements, which was April, base point was in mid-'02).
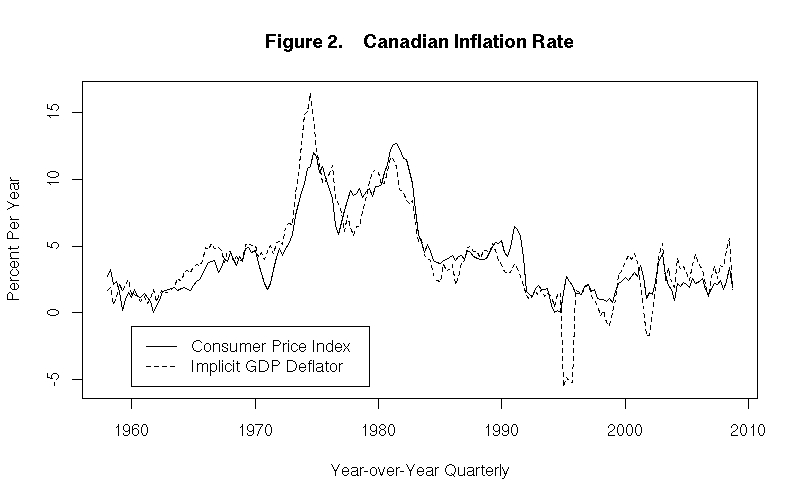
Reference graph re: inflation using two different methods from University of Toronto for anyone interested:
Apologies if I have caused any confusion, or am wrong in my use.

Given that CPI is a Laspeyres index and tends to overstate inflation I was hoping that making use of it in this case would also give a little bit of cushioning as well error-wise in giving my thoughts quickly. Since it was easy to find the CPI stats I figured it would be fast to go from that, especially ince the base point they used appeared to correlate nicely with the time ASLplease said that this house was bought, which he then indicated had doubled in value.


") CKA Uber
CKA Uber 

![[drool]](./images/smilies/droolies.GIF "Drool") (In best Homer Simpson voice)
(In best Homer Simpson voice)
